Tron, the cryptocurrency founded by Justin Sun, has pulled back over the past two months, erasing some of the gains it made in 2024.
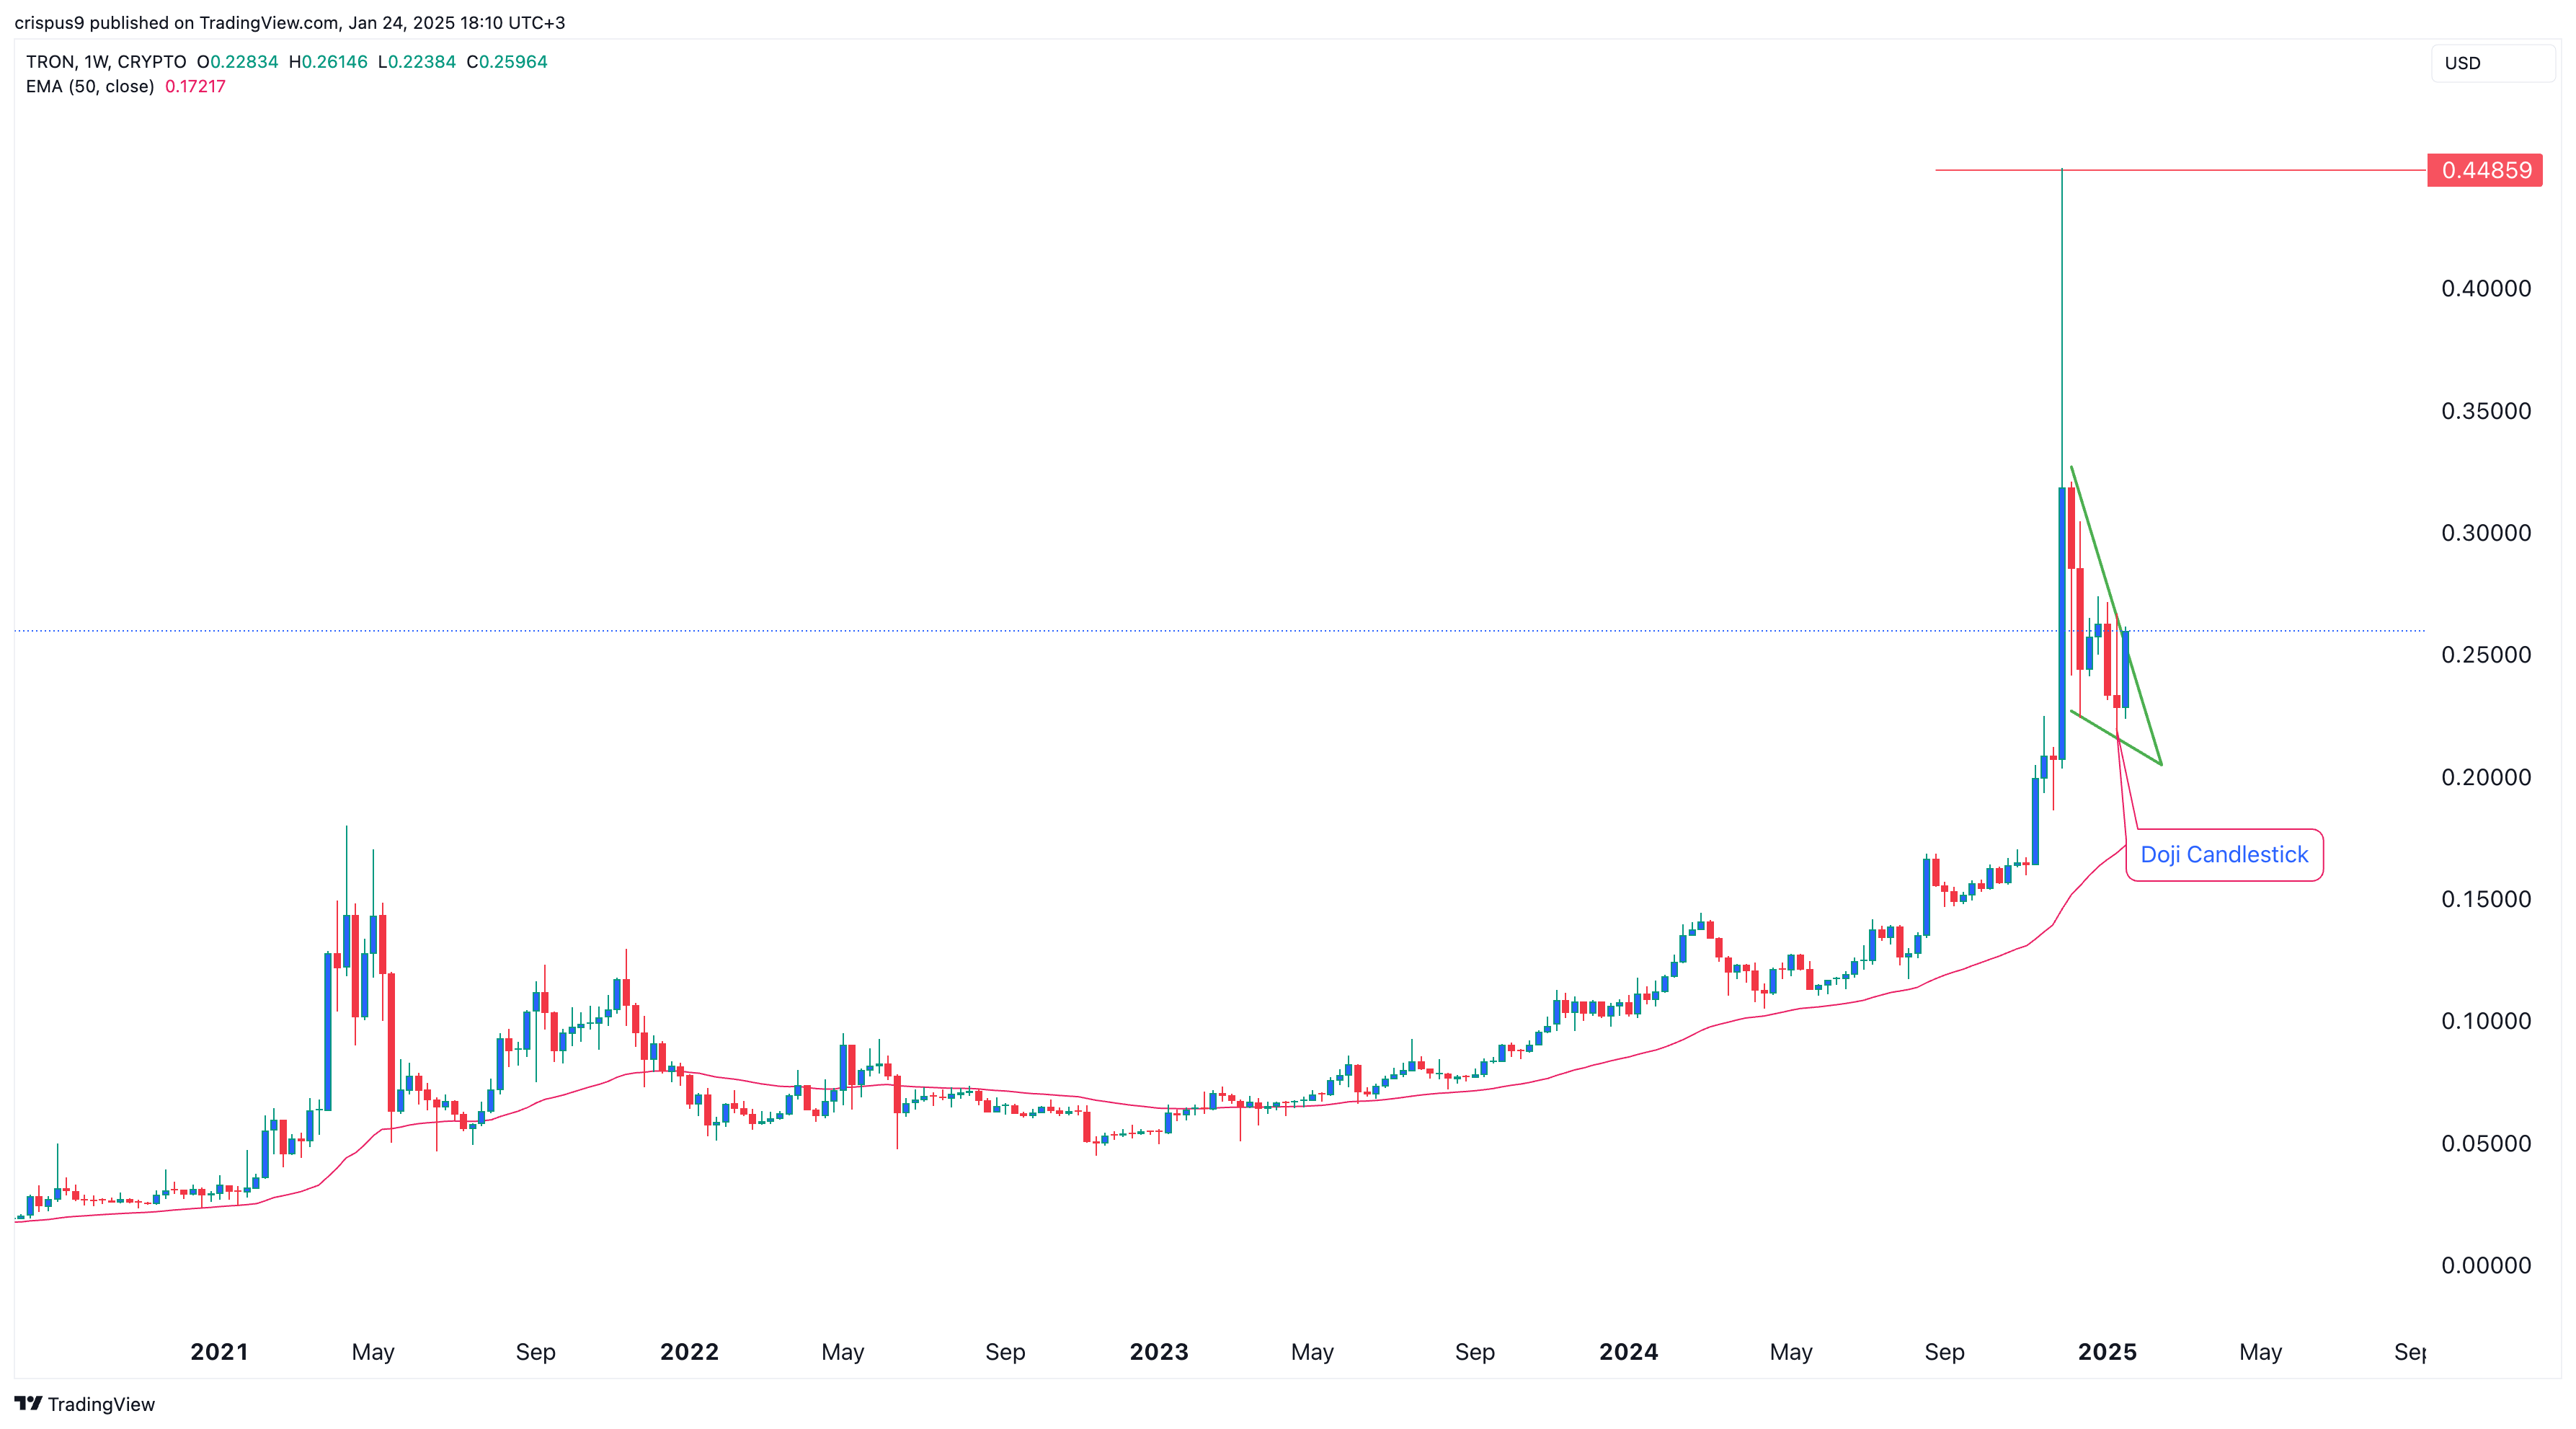
Tron (TRX) has dropped to $0.2575, representing a 43% decline from its 2024 high, bringing its market cap to approximately $22 billion. However, the charts below suggest that the coin could bounce back and potentially retest its 2024 high.
TRX price formed a falling wedge pattern
The weekly chart indicates that Tron has remained above the 50-week moving average, signaling that its long-term bullish trend remains intact.
Additionally, TRX has formed a falling wedge pattern, characterized by two descending and converging trendlines. This chart pattern often leads to a strong bullish breakout when the two lines approach their confluence.
Tron has also formed a doji candlestick pattern, identified by a small body with long upper and lower shadows. These chart patterns collectively point to a potential rebound in the coming weeks.

Tron Network is highly profitable
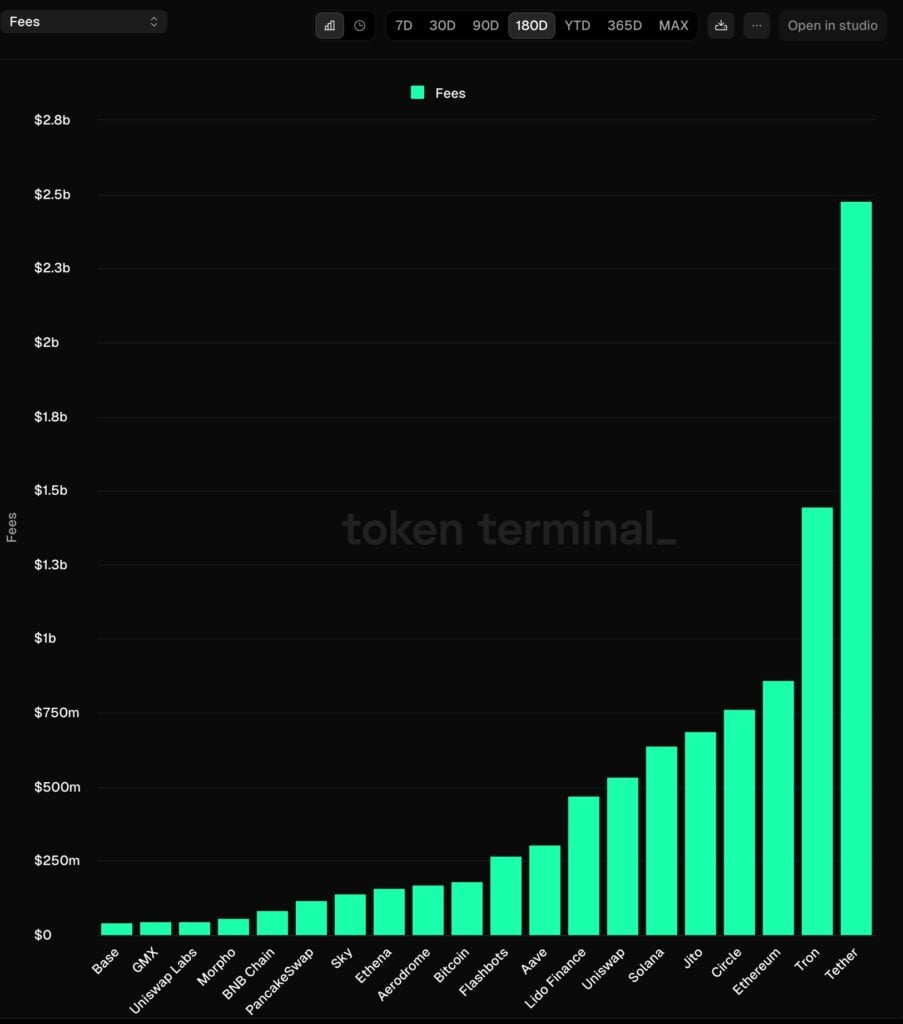
Meanwhile, Tron has established itself as the most profitable layer-1 network in the crypto industry. The chart below shows that the network has generated $1.44 billion in fees over the past six months. In comparison, Ethereum (ETH) has made $857 million, while Solana (SOL) made $636 million in the same period.
These fees are significant for Tron holders because they receive a portion as staking rewards. Currently, Tron offers a staking yield of approximately 4.5%, higher than Ethereum’s 3%.

Tron supply continues to fall
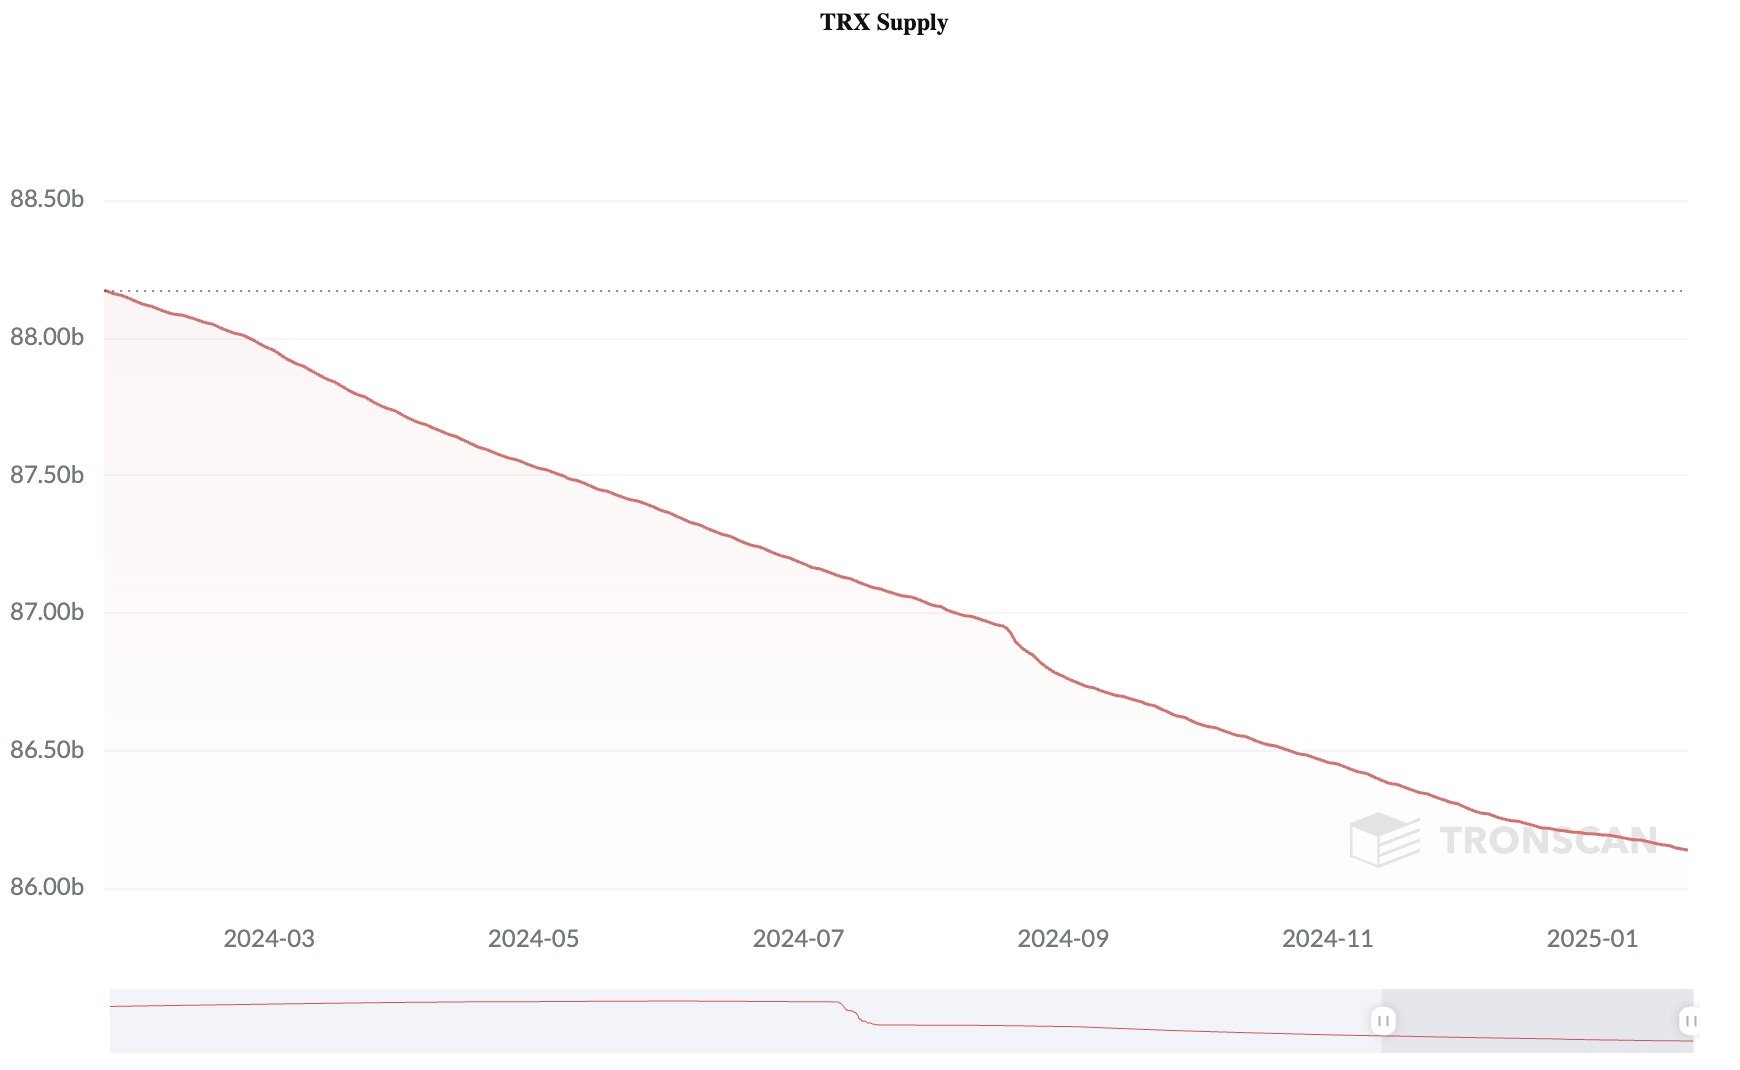
Another critical factor is the decreasing supply of Tron in circulation. According to TronScan, TRX is one of the most deflationary tokens in the crypto industry, with an annual deflation rate of -2.83%.
There are currently 86.14 billion TRX tokens in circulation, down from 88.6 billion on the same date last year. This trend is driven by the fact that the number of newly minted TRX tokens is consistently smaller than the amount burned. For example, on Thursday, Tron burned 7.7 million tokens while generating only 5.06 million.

Tron account holders are steady
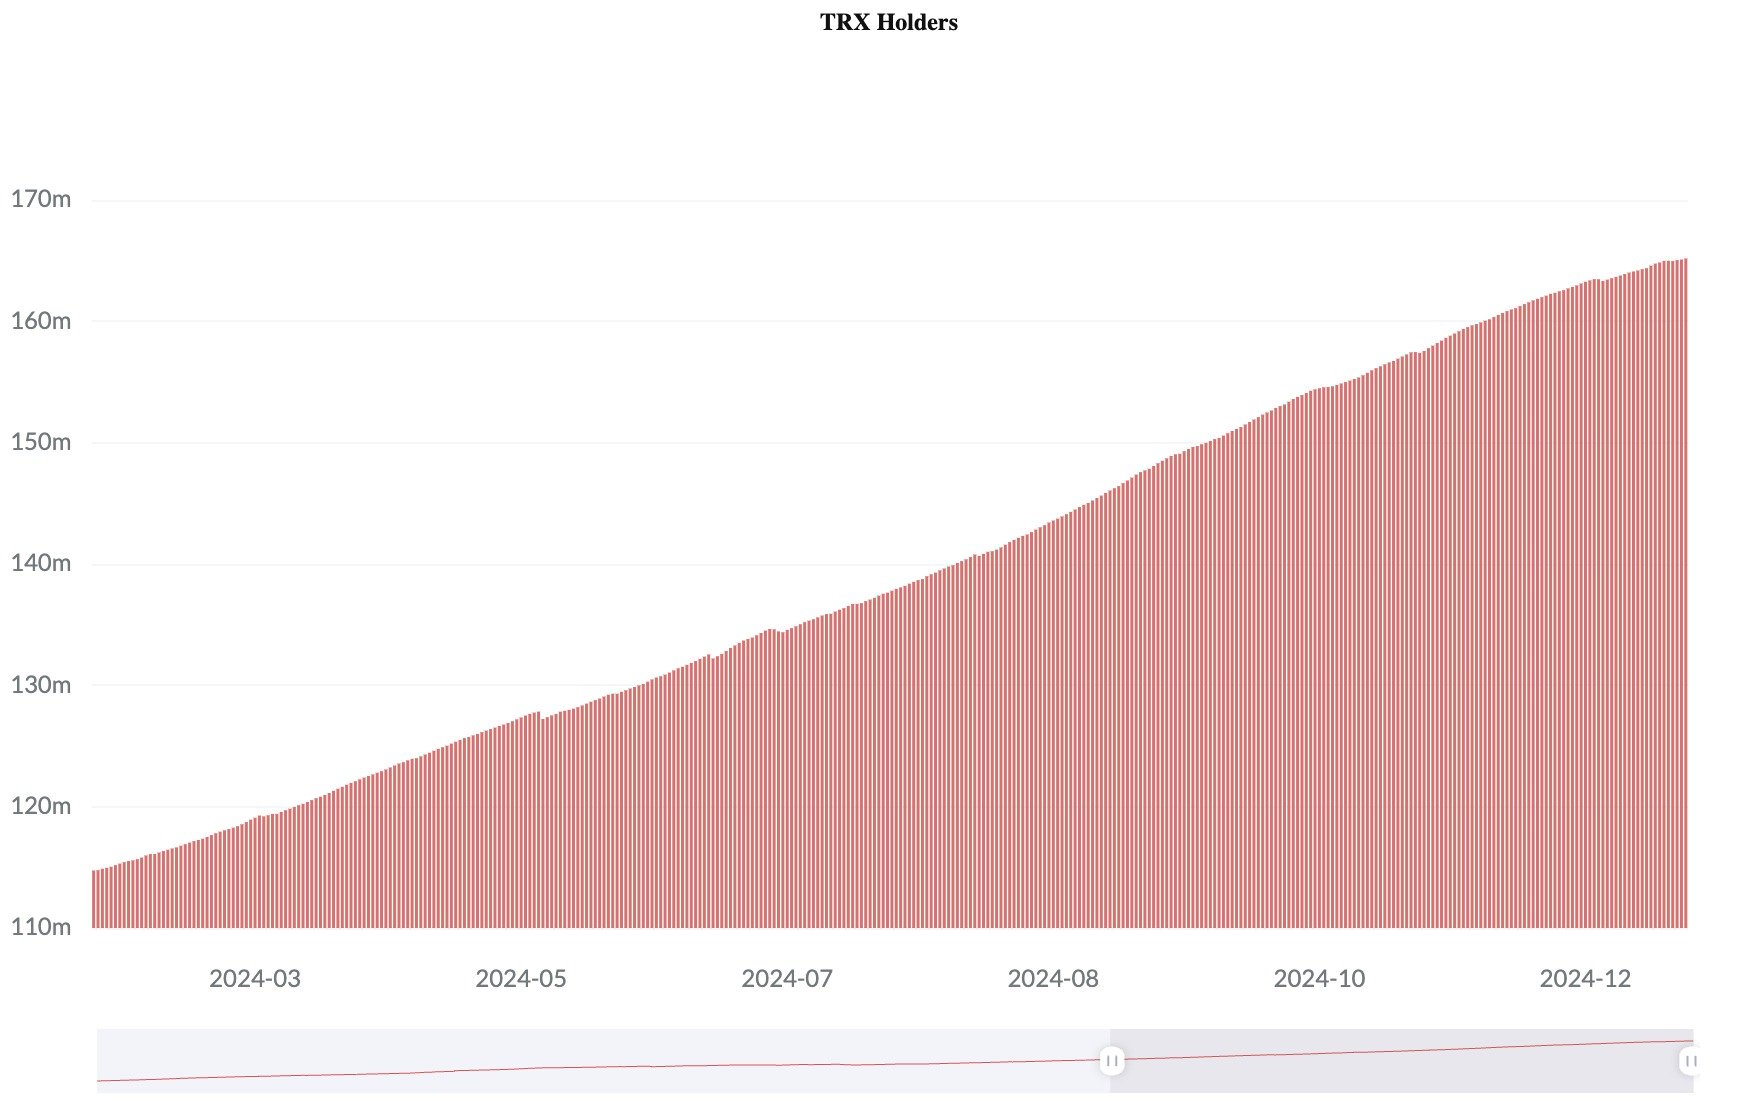
The number of Tron account holders has also grown steadily, further solidifying its position as one of the most active networks in the crypto space. There are currently over 165.17 million accounts holding TRX, up from 114 million on the same day last year. This growth signals increasing adoption among investors.

The other key important data on Tron is the substantial sums of Tether (USDT) that pass through its network. It handled a volume worth $156 billion on Thursday, up by 18% from a day earlier.
