
Bitcoin and Ethereum hold steady as ETF flows, Fed bets, and new regulatory actions have crypto in a holding pattern.
Bitcoin (BTC) and Ethereum (ETH) slipped a little in the last 24 hours, as BTC fluctuated around the mark of $115,000, and ETH around the mark of $4,160 on Tuesday.
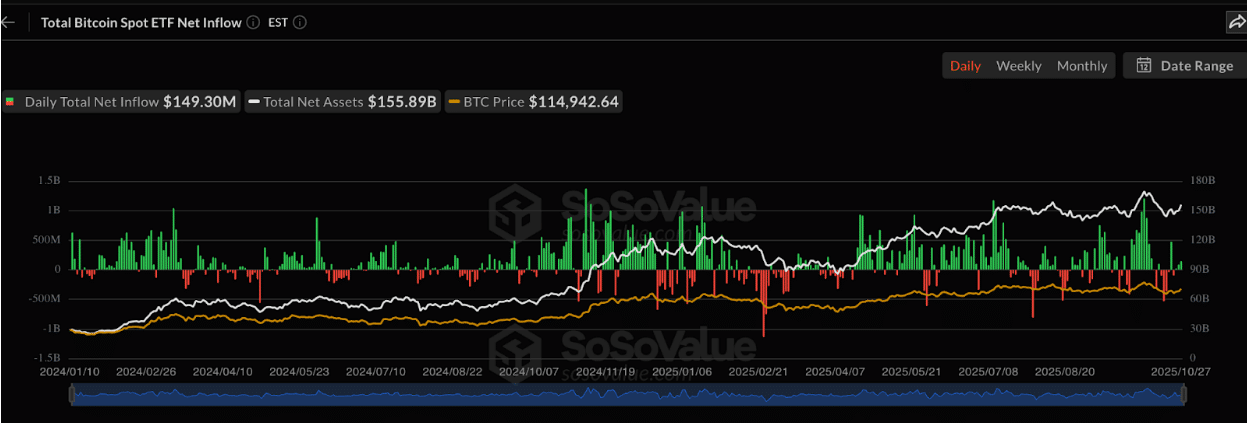
SoSoValue data shows that US spot Bitcoin ETFs recorded a net inflow of $149 million, indicating that investors were consistently showing interest in Bitcoin irrespective of the price fluctuations.
Why Did Bitcoin Attract $931M While Ethereum Logged Outflows?
According to CoinShares’ report, investors added about $931 million into Bitcoin funds last week, even as ether products logged $169 million in outflows.
The split has continued this week, pointing to stronger demand for BTC than ETH.
Reuters reported that Canary Capital plans to roll out the first US spot Litecoin and Hedera ETFs on Tuesday. Bitwise is preparing a Solana-focused product, a move seen as testing the.
A separate report said the SEC is “poised” to approve Hedera and Litecoin ETFs, suggesting more altcoin products may soon enter the market.
In Washington, the White House has nominated crypto policy lawyer Mike Selig to lead the Commodity Futures Trading Commission, signaling continued focus on digital-asset oversight and market structure.
Meanwhile, 10x Research warned that Bitcoin may now be too expensive for steady retail buying, which could weaken expectations for a longer-running bull cycle.
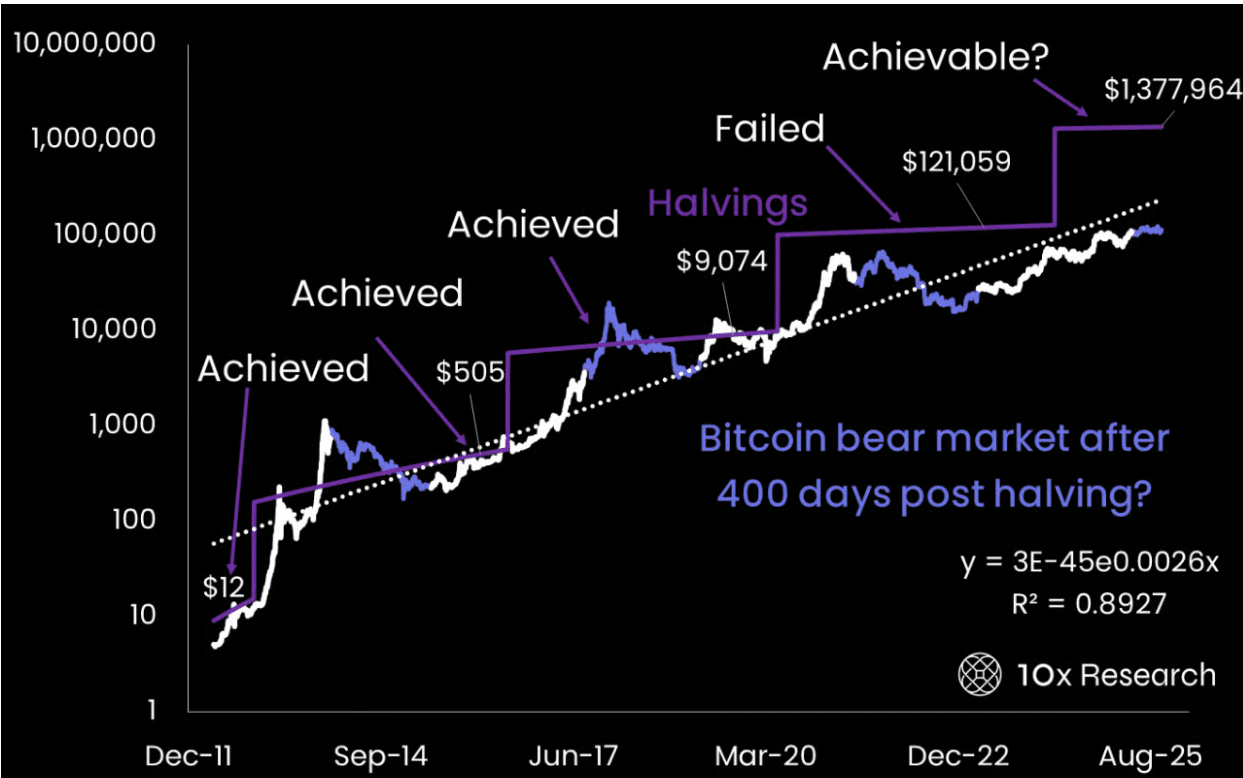
The firm said recent optimism about an extended market phase might not hold if everyday buyers begin to pull back.
Bitcoin is only 16 years old, so drawing “firm statistical conclusions” from such a limited history is still “highly questionable,” the report said.
Lookonchain reported BlackRock’s spot Ethereum ETF bought 17,238 ETH worth about $70.69 million on Oct. 27.
Oct 28 Update:
10 #Bitcoin ETFs
NetFlow: +1,458 $BTC(+$167.4M)#BlackRock inflows 567 $BTC(+$65.15M) and currently holds 805,807 $BTC($92.51B).
9 #Ethereum ETFs
NetFlow: +27,066 $ETH(+$111M)— Lookonchain (@lookonchain) October 28, 2025
It is also preceded by the US SEC signing off on spot ETFs of the ETFs, which are spot-ETFs, and these are indicative of the confidence BlackRock has in Ethereum as a long-term asset.
DISCOVER: Best New Cryptocurrencies to Invest in 2025
Bitcoin Price Prediction: Can Bitcoin Hold Above $113,500 to Sustain Bullish Momentum?
As per Ted’s analysis, Bitcoin is trading at a high of about $114,000 and has bounced off the support of $113,500. This level has served as a stable floor in retests.
The chart indicates that there is evident buying interest within $112,000 to $113,500, and traders intervened again to protect further losses.
Overhead, sellers appear active between $116,500–$118,000 and again at $121,000–$125,000. If price moves above $117,500, the next target sits near $119,000, with room to stretch toward the $121,000 area.
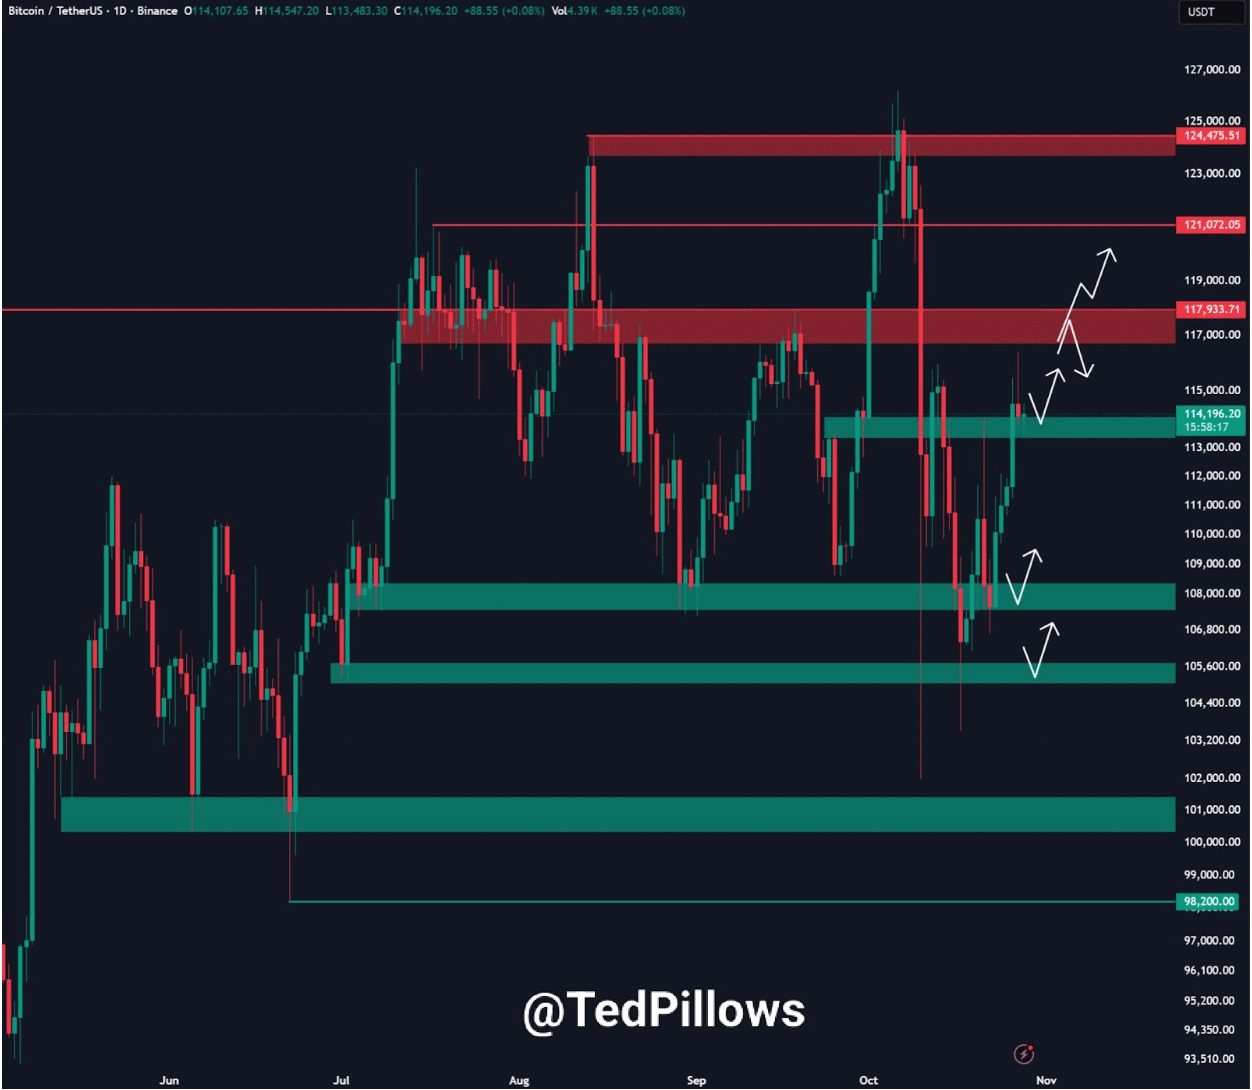
If momentum cools, Bitcoin may dip back toward $111,000–$112,000. A break below that band could pull the market toward $108,000, with another demand pocket near $105,600.
For now, price remains stuck in a broad range. Support is layered below, while supply caps upside moves. The near-term outlook stays positive as long as BTC holds above $113,500.
Analyst Ali Martinez noted $111,160 as firm support based on cost-basis data. He placed resistance near $117,630, where more sellers are likely to appear.
For Bitcoin $BTC, $111,160 acts as key support while $117,630 remains the resistance to break for bullish continuation. pic.twitter.com/cRqVDrmdiZ
— Ali (@ali_charts) October 28, 2025
A move above that line could signal continuation. If not, Bitcoin may stay in its current consolidation phase.
DISCOVER: 20+ Next Crypto to Explode in 2025
Ethereum Price Prediction: Does Selling Pressure Near Resistance Threaten a Pullback to $3,800?
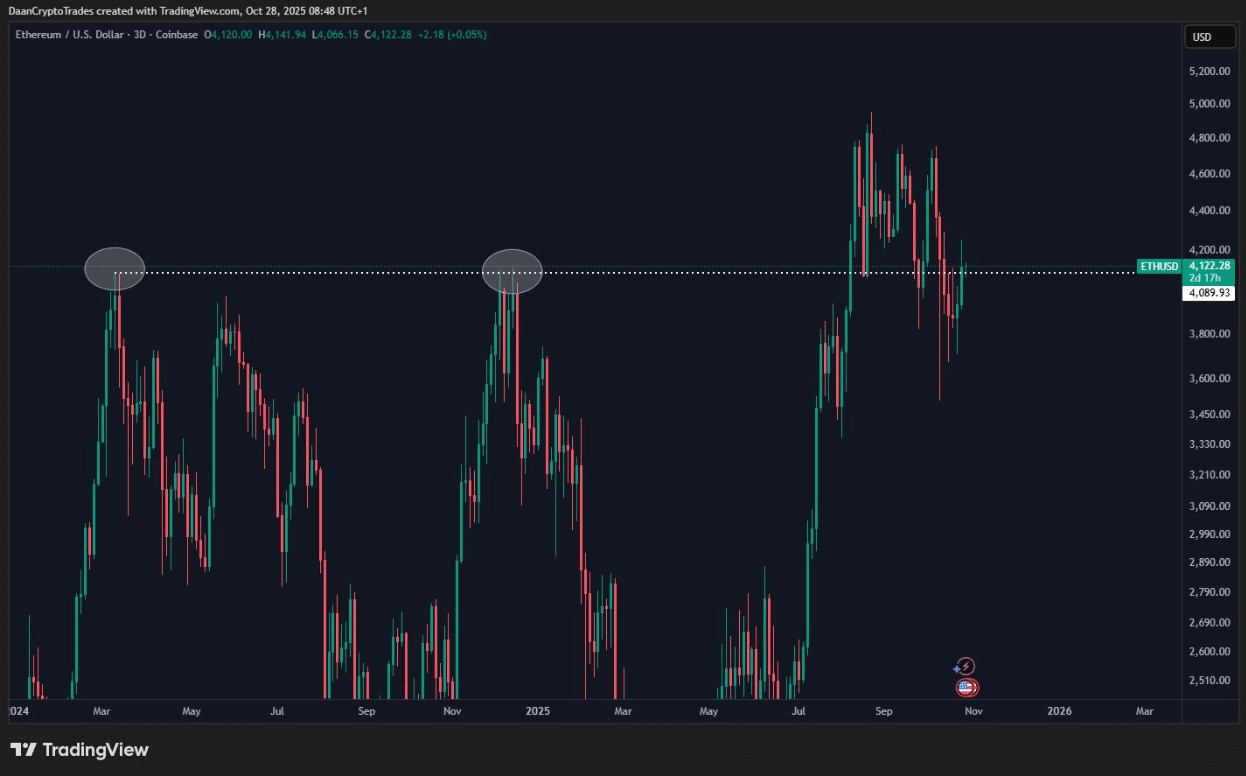
According to Daan Crypto, Ethereum is once again pushing into a major resistance area that previously marked cycle highs.
$ETH Big test here around its previous cycle highs.
For me, this is the level to break and hold if the bulls want to get back to the highs in due time.
Another rejection here would not be great for this larger timeframe view. https://t.co/xNJtY203aA pic.twitter.com/a4uoiZ6K1z
— Daan Crypto Trades (@DaanCrypto) October 28, 2025
The three-day chart indicates that ETH is trading under the first horizontal zone, which has already rejected the price previously in March 2024 and then in late 2024.
These two reversals have been sharp, demonstrating how strong this supply area has been.
Recent price movement indicates that a gradual upward trend will start off the lows of mid-2025, and the higher swing points will assist in regaining structure.
The rally has calmed down, yet support of the trend exists.
The new candles indicate a reluctance with various wicks touching back resistance and indicating further selling.
The pattern looks like a multi-top forming under a flat ceiling. If ETH can break above this zone and hold, buyers may regain control and push toward $4,600 to $4,800.
But if resistance holds again, price could pull back toward $3,800, or even toward a broader demand zone near $3,500.
DISCOVER: 20+ Next Crypto to Explode in 2025
Join The 99Bitcoins News Discord Here For The Latest Market Updates
The post Bitcoin & Ethereum Price Forecast: Consolidation Ahead? appeared first on 99Bitcoins.