
Polygon price has pulled back and entered a local correction, falling by ~16% from its highest point this month.
Summary
- Polygon price has rebounded by 55% from its lowest point this year.
- Data shows that its network fees have jumped by 235% in the last 30 days.
- Its active addresses and transactions have also soared in this period.
Polygon (POL) token moved to $0.1540, and technical indicators suggest a surge as its fundamentals improve.
Data compiled by Nansen indicates that its network activity has increased significantly in the past few weeks. For example, its fees have soared by 235% to $2.64 million, making it one of the fastest-growing networks in the crypto industry. In contrast, Ethereum’s fees dropped by 32%, while Avalanche’s fell by 42%.
Polygon’s active addresses rose by 15% to 14.7 million, while its transactions hit 178 million. Ethereum had 14.5 million active addresses and handled 56 million transactions.
These metrics have led to a surge in POL’s burn rate, with millions of tokens being removed from circulation each day.
Most importantly, there are signs that this growth will accelerate in the coming months, as Polygon has positioned itself as the preferred chain for the payments industry. It has already signed agreements with some of the largest players like Mastercard, Shift4 Payments, Revolut, and Stripe.
Polygon announced that it acquired Coinme and Sequence earlier this week. These acquisitions helped it enter the US-regulated market, where it will be offering fiat on/off-ramp solutions.
In addition to payments, Polygon is the largest chain for the burgeoning prediction market, as it powers Polymarket, the industry’s largest player. Polymarket handled over $2.59 billion in volume in the last 30 days.
Polygon price technical analysis
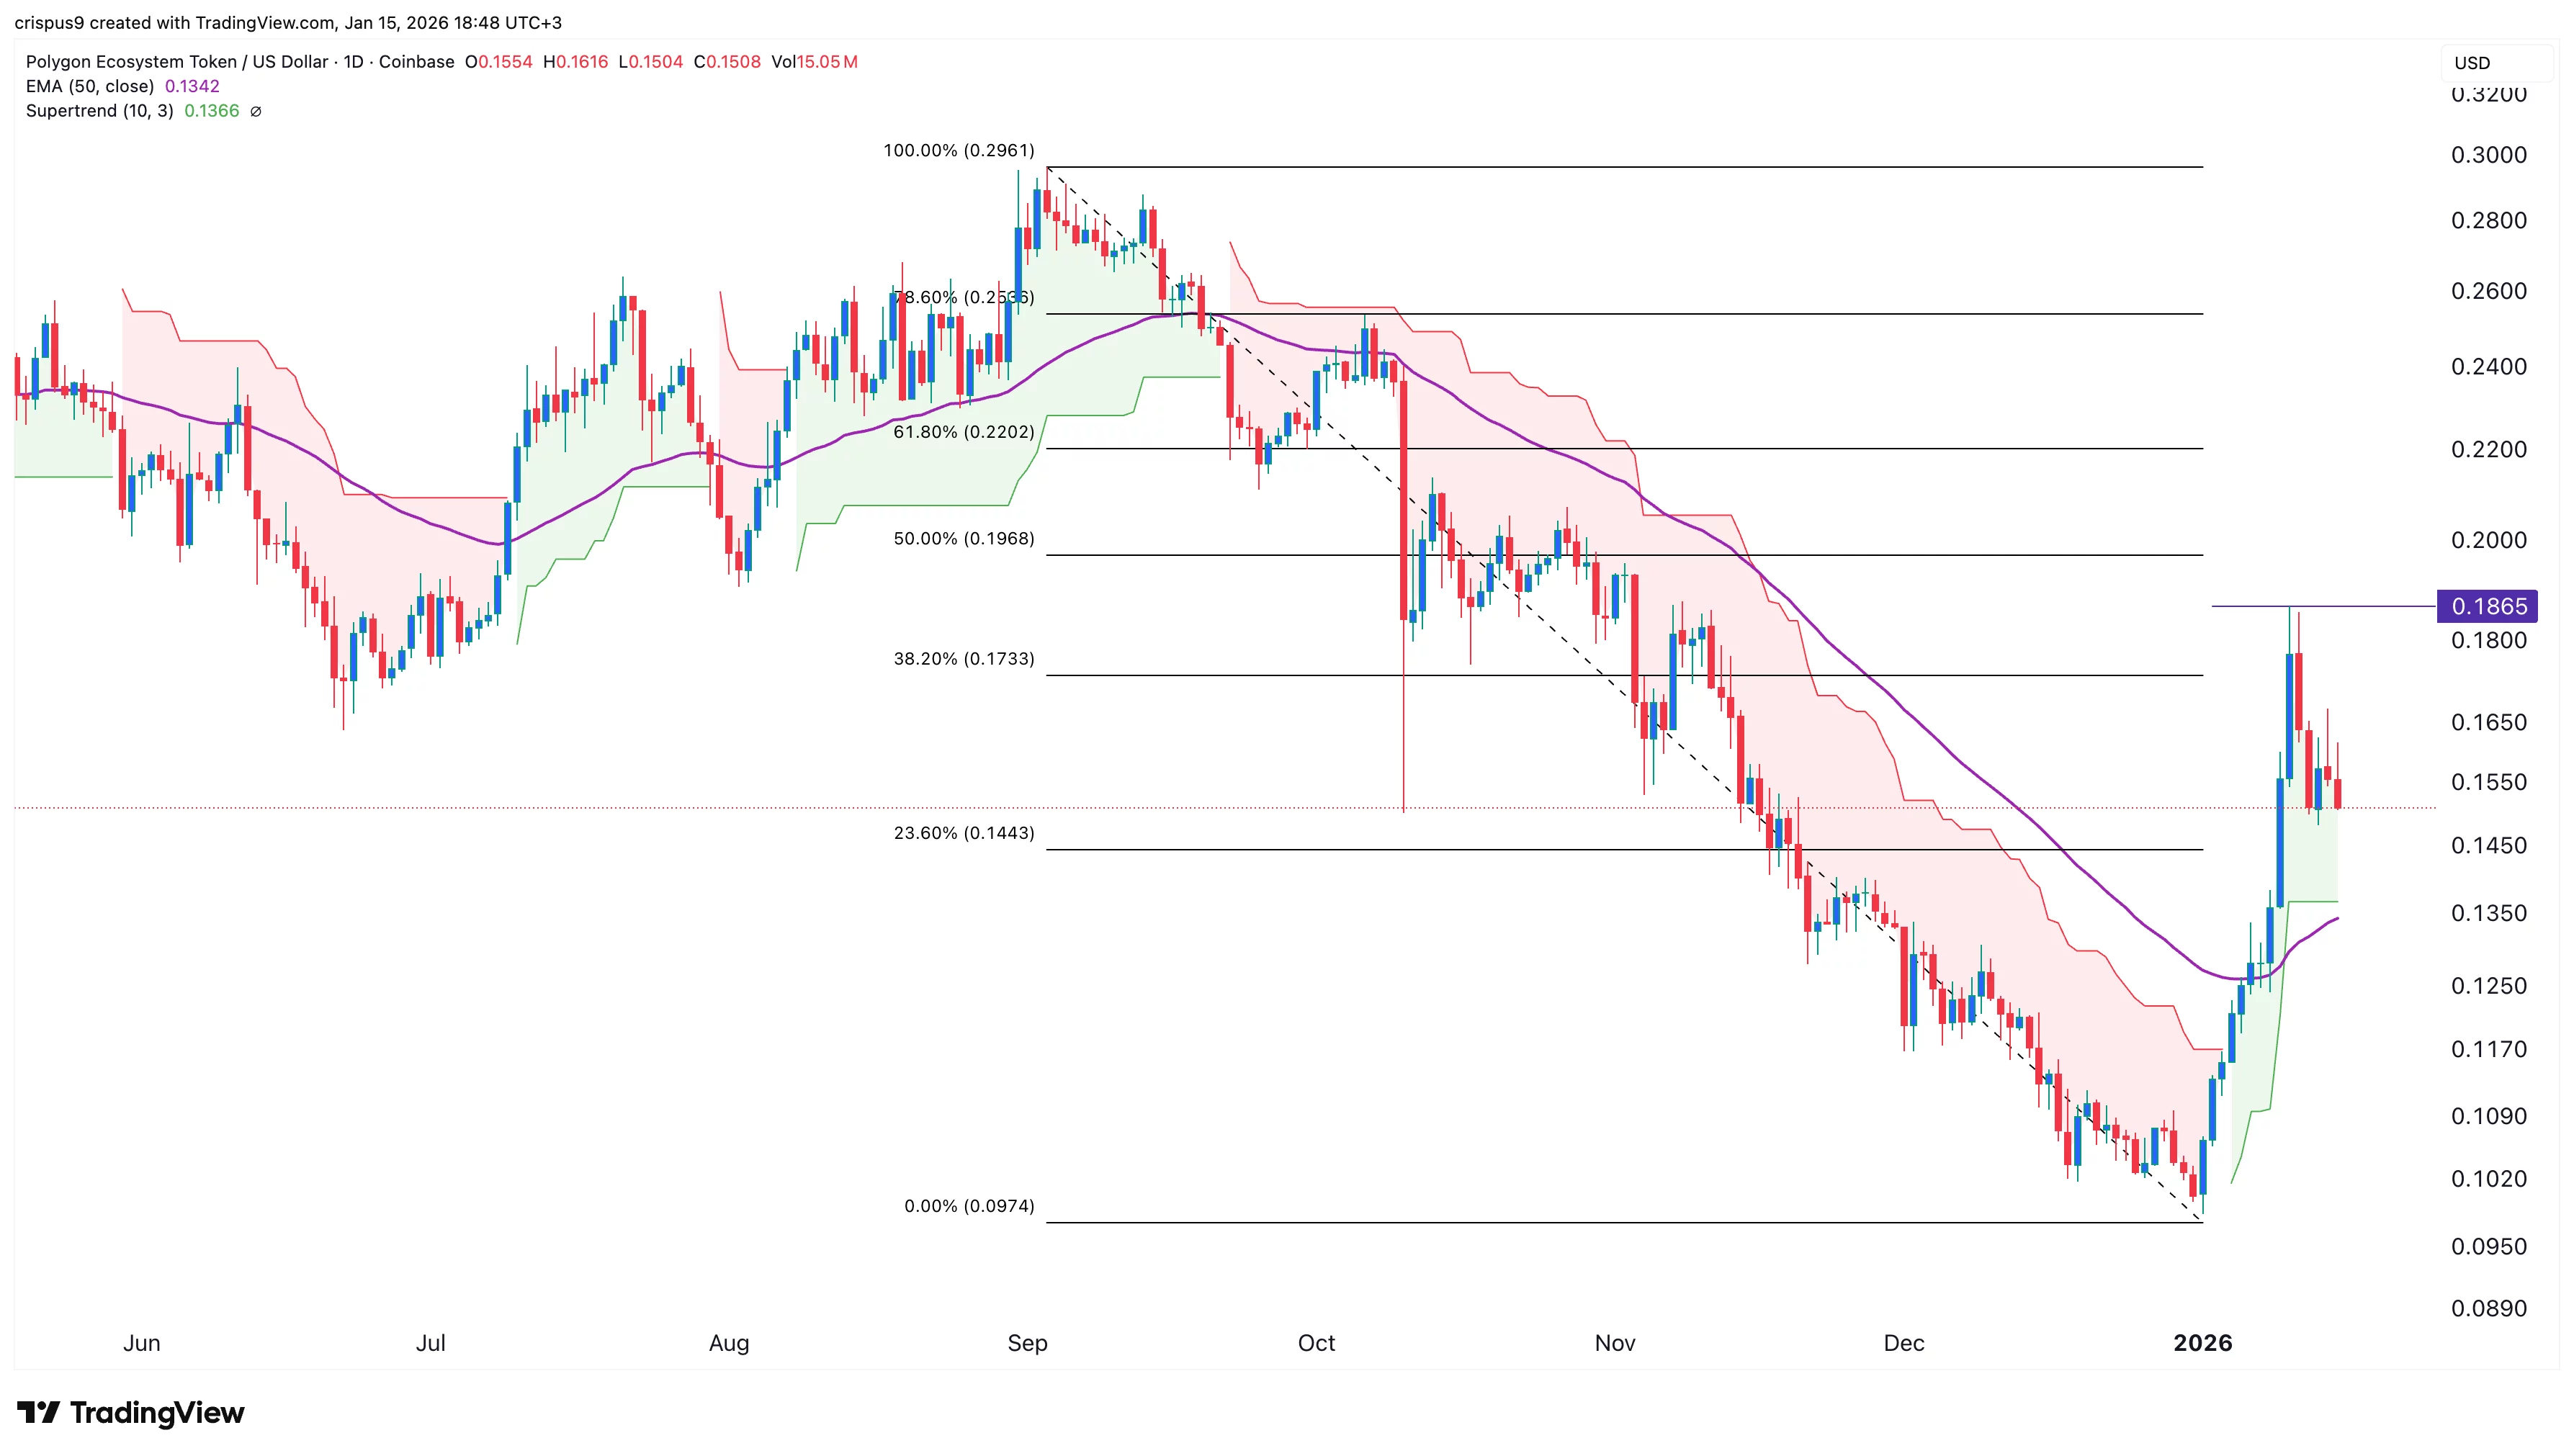
The daily chart shows that the POL price has rebounded in the past few months. It has rebounded from $0.0974 earlier this month. It has since retreated to $0.1520 as investors booked profits.
The ongoing pullback indicates that it has entered the second phase of the Elliott wave. This wave is typically characterized by a pullback, followed by the third wave, which is usually the longest.
It has remained above the 50-day Exponential Moving Average and the Supertrend indicator. Therefore, the most likely scenario is where it rebounds and hits the key resistance at $0.2960. This target is at its highest point in September and is 90% above the current level.