Solana price crashed for two straight days as the ongoing crypto market sell-off hit its meme coin ecosystem.
Solana (SOL) dropped to $127 on Saturday, down by 15% from its highest point this week. It has dropped to its lowest level since March 2021.
The decline happened as most Solana meme coins crashed, erasing most of the gains made earlier this week. Fartcoin (FARTCOIN) crashed by 15% on Saturday, while popular tokens like Popcat (POPCAT), ai16z (AI16Z), and Bonk (BONK) fell by over 10%.
The market cap of all Solana meme coins tracked by over 10% to $7.2 billion. This drop means that these tokens have erased over $18 billion in value in the last few days.
Third-party data shows that crypto traders bought the Solana meme coin rally earlier this week.
According to DeFi Llama, Solana’s DEX volume soared by 60% in the last seven days to over $3 billion. This volume was higher than Ethereum (ETH) and BSC, which handled $11.35 billion and $8.9 billion, respectively. It was the first time in weeks that Solana’s DEX protocols did better than the two.
Most of Solana’s DEX volume came from Pump, which handled over $2.8 billion worth of transactions. It beat other popular DEX networks like Orca, Meteora, Raydium, and Lifinity, which have long had a big market share.
Solana had some other positive news this week. The most notable one was that Blackrock, the biggest asset manager globally, expanded BUIDL, its money market fund, to the network. This is a notable development since BUIDL’s assets have surged to over $1.86 billion.
Solana price technical analysis

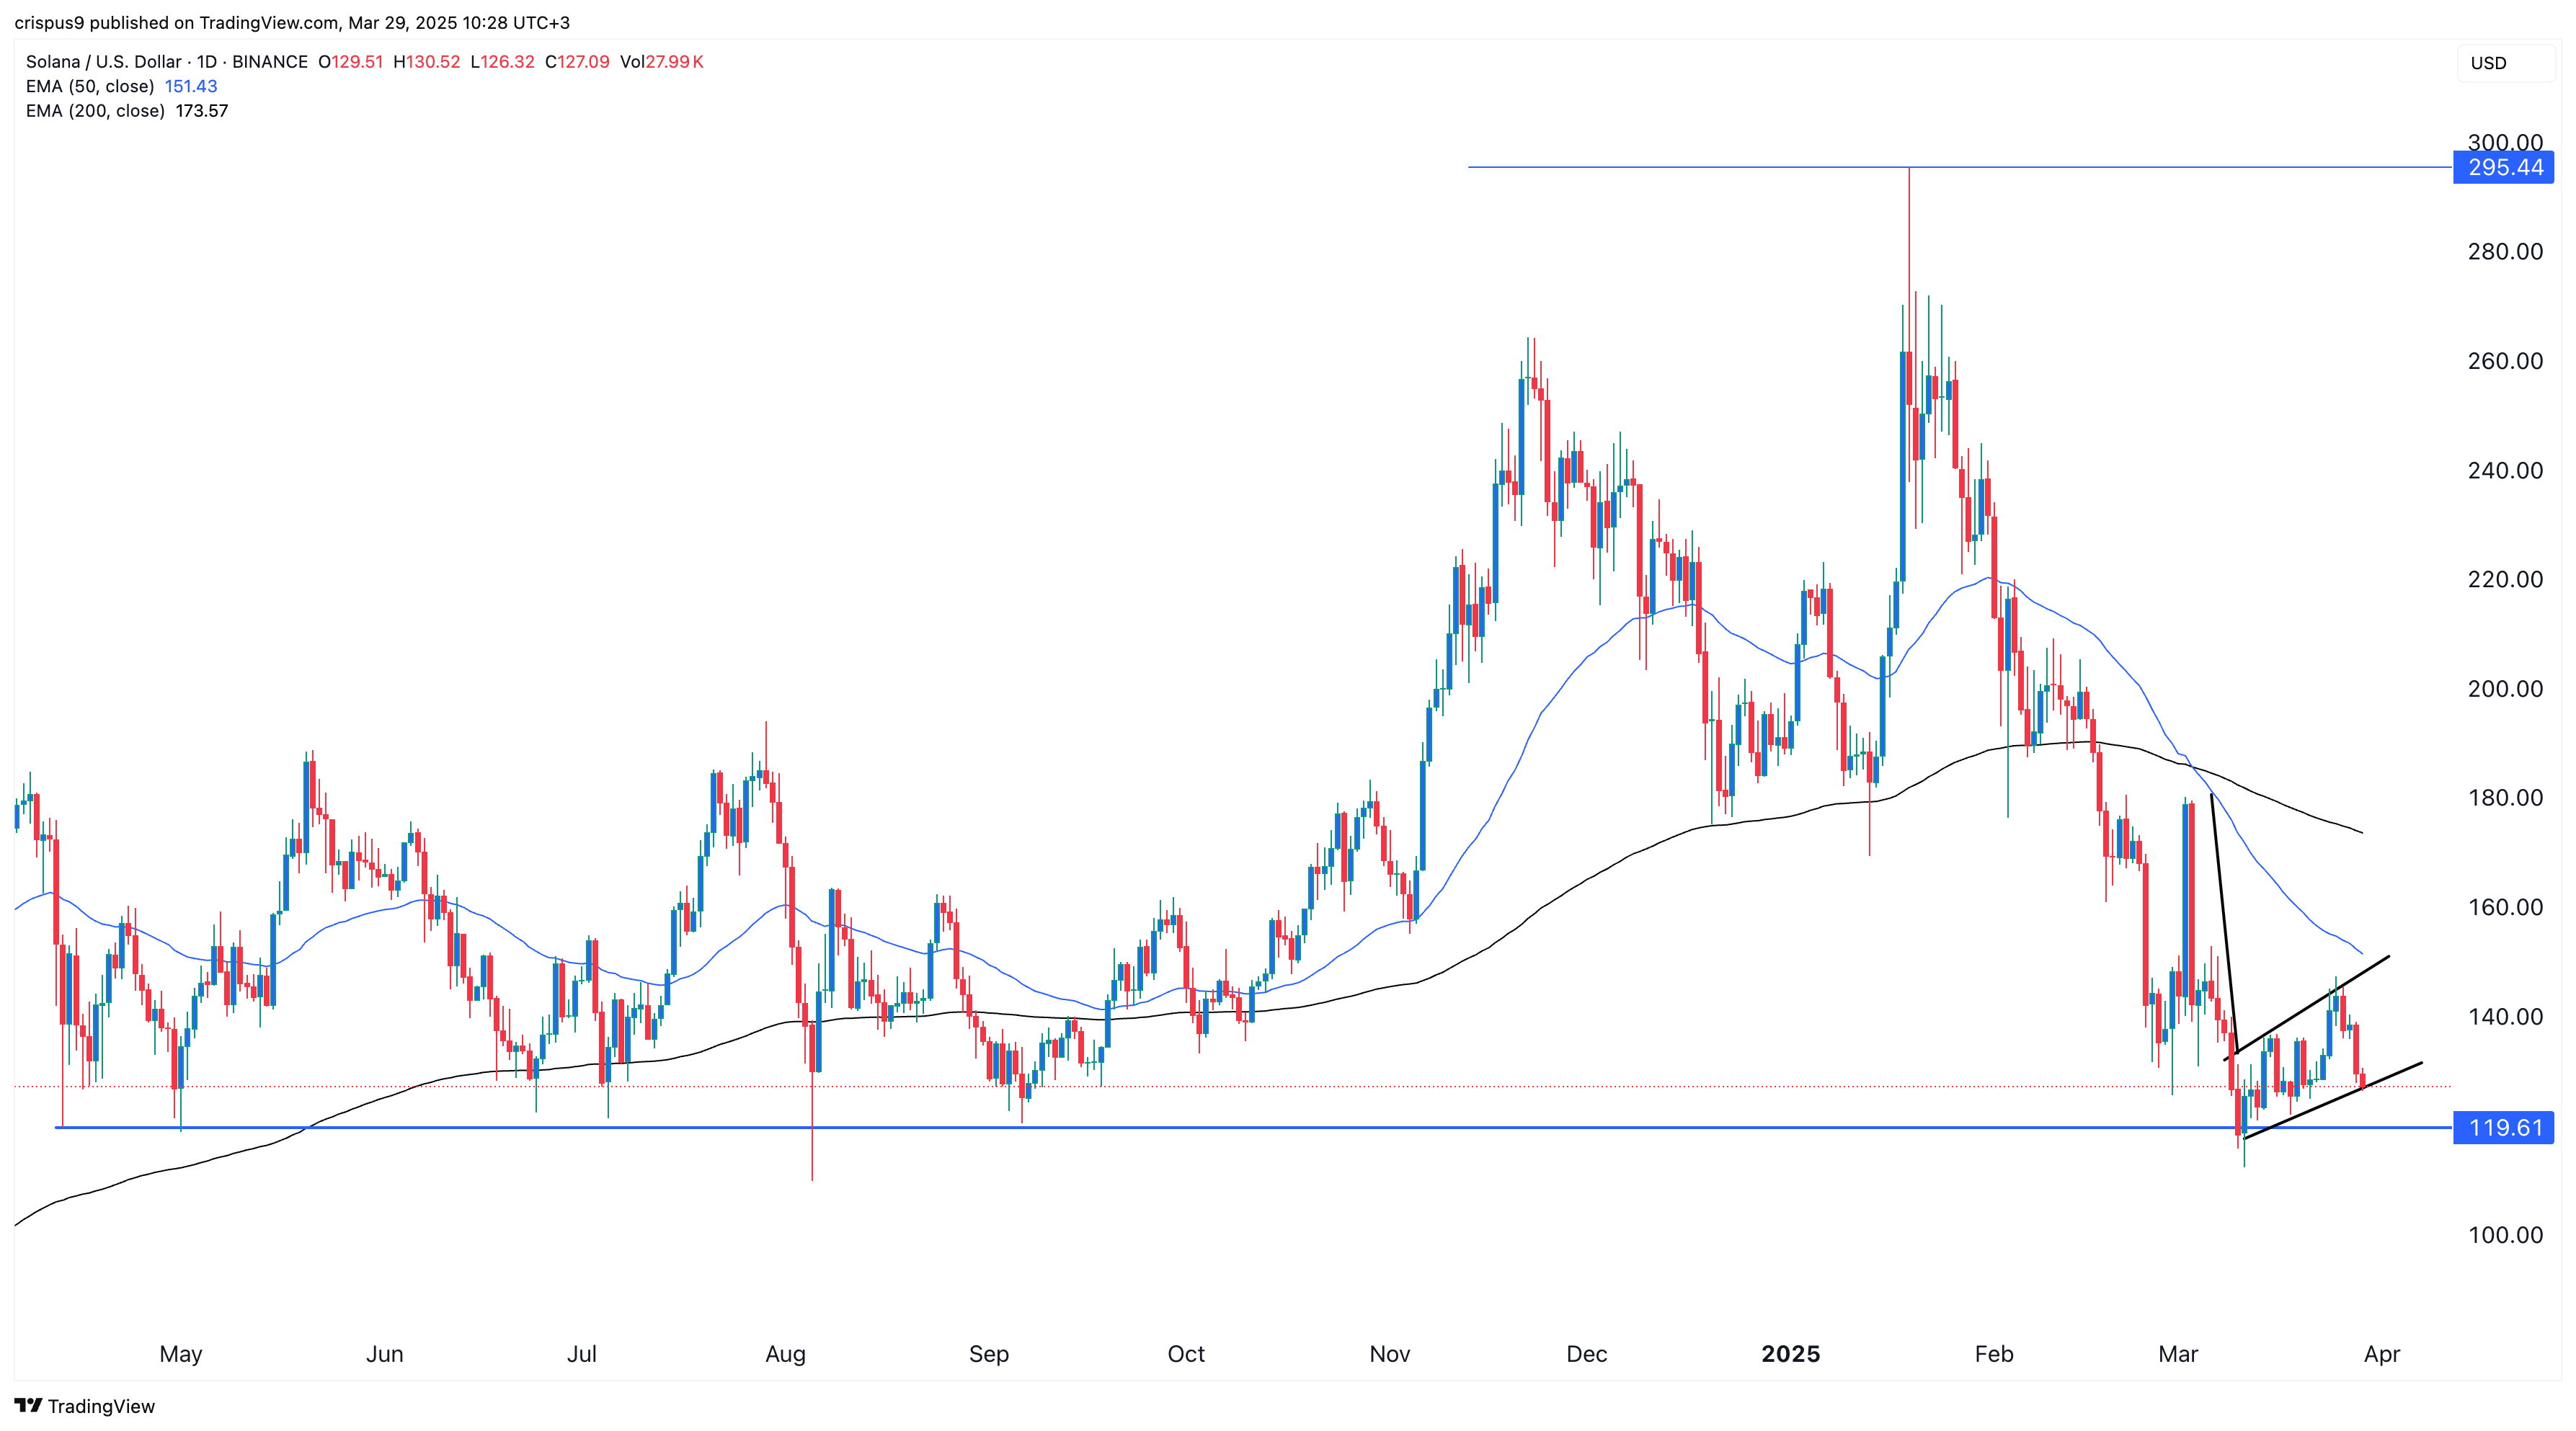
The daily chart shows that Solana coin has plunged in the past few months, moving from January’s high of $295.45 to $126. Most recently, it has formed a bearish flag pattern, which is made up of a tall vertical line and a rectangle.
Solana also formed a death cross pattern on March 4 as the 50-day and 200-day moving averages flipped each other while pointing downwards.
Therefore, a combination of a death cross and a bearish flag points to a strong breakdown, potentially to $100. For this to happen, it will need to plunge below the support at $120, where it has failed to drop below several times since April last year.
