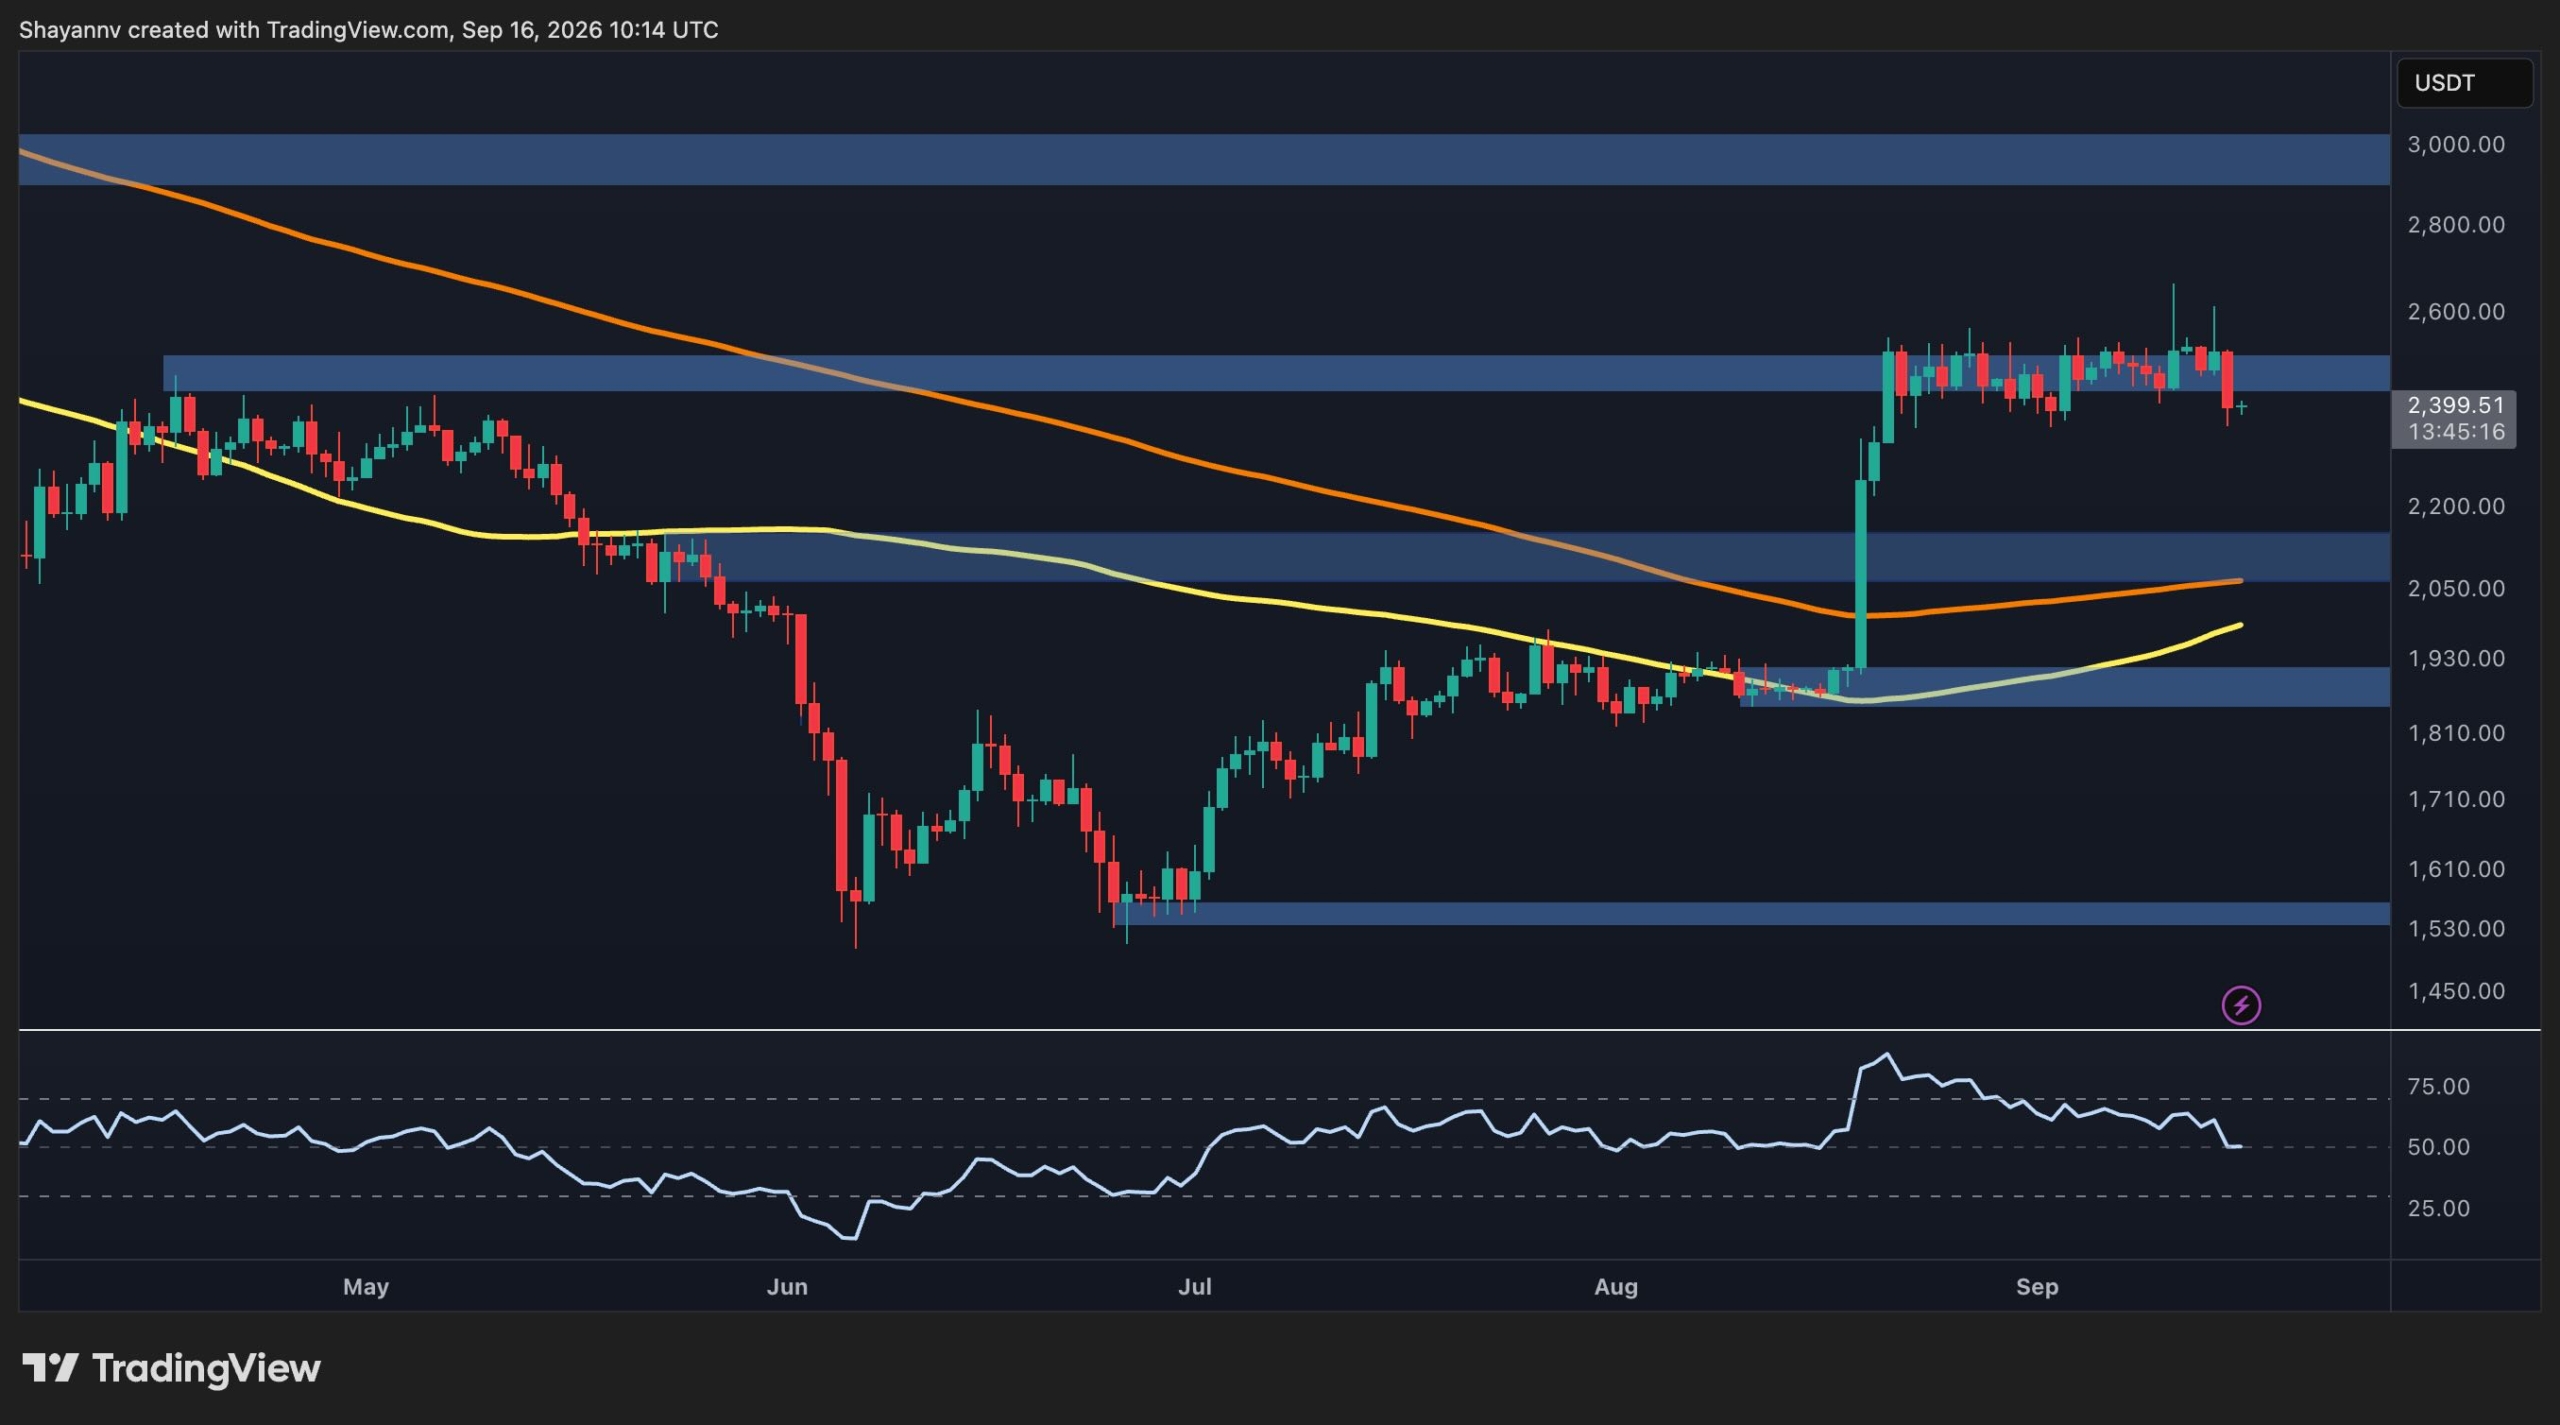
Ethereum is still trading around $2.4K after a sharp recovery from the $1.5K area. The latest charts show ETH consolidating beneath the $2.5K resistance region, while supply continues to tighten. The technical structure remains constructive on the higher timeframe, although short-term momentum has weakened.
Ethereum Price Analysis: The Daily Chart
The daily chart shows a significant structural improvement compared with the June lows. ETH formed a base around the $1.5K-$1.6K region before beginning a sustained recovery that eventually pushed the price above the $2K area and into the $2.5K zone.
The most important near-term resistance is the $2.5K zone, where ETH has spent several weeks consolidating. The price has repeatedly struggled to confirm a breakout above this range, and the latest candles show another rejection at this level. A decisive daily close above $2.5K could open the way toward the next major psychological resistance around $3K.
On the downside, the first important support appears around $2.0K-$2.1K. This zone is particularly significant because it also closely overlaps with the 100-day and 200-day moving averages. The 200-day moving average is around $2.05K and is rising, while the 100-day moving average is also turning upward near the $1.95K area. Holding this region would help preserve the improving medium-term structure.
ETH/USDT 4-Hour Chart
The 4-hour chart demonstrates a more granular picture of the current consolidation. ETH experienced a powerful upside move around August 19-22, climbing from roughly $1.9K toward the $2.5K region. Since then, the market has largely remained inside a broad horizontal range.
The range currently appears to extend from approximately $2.35K to $2.6K, with the $2.5K zone acting as the central resistance area. ETH is now trading around $2.4K after recently falling from the upper half of the range.
The immediate technical concern is that the price has moved toward the lower boundary of the range. The $2.35K area is therefore an important short-term support. If buyers defend this region and reclaim $2.5K, the range could remain intact, and the upper boundary near $2.6K could come back into consideration.
Conversely, a breakdown below $2.35K would weaken the range structure. In that scenario, the next visible support is the $2.25K order block. A loss of that region would expose the broader $1.9K support area.
The 4-hour RSI has fallen toward the 30 region, indicating that short-term momentum has become significantly weaker following the rejection from the $2.5K area. This leaves room for a technical rebound, but the RSI alone does not confirm that a durable bottom has formed. Price’s reaction around $2.3K-$2.35K should therefore be important for determining whether this is simply a pullback within the range or the beginning of a deeper correction.

On-Chain Analysis
The exchange-reserve chart shows a clear long-term decline in ETH held on exchanges. The visible reserve level has fallen from above 21M ETH during the first half of 2025 to approximately 14.6M ETH currently.
Notably, the decline in exchange reserves has continued even as ETH recovered toward $2.4K. This indicates that the amount of ETH tracked on exchanges has been trending lower rather than expanding alongside the recent price recovery.
A continued reduction in exchange balances can mean that fewer coins are immediately available on exchanges for potential selling, which can reduce readily available exchange supply. However, the metric by itself does not establish future price direction, since ETH can move between exchanges, wallets, custodians, and other entities for numerous reasons.
From a technical perspective, however, the combination is worth watching. ETH remains below the key $2.5K resistance, while exchange reserves are near their lowest visible level on this chart. If ETH manages to reclaim $2.5K while reserves continue declining, it would provide a supportive backdrop for the breakout. On the other hand, failure to hold the $2.3K-$2.35K 4-hour support would keep the market in a corrective phase despite the longer-term decline in exchange reserves.

Disclaimer: Information found on CryptoPotato is those of writers quoted. It does not represent the opinions of CryptoPotato on whether to buy, sell, or hold any investments. You are advised to conduct your own research before making any investment decisions. Use provided information at your own risk. See Disclaimer for more information.
